I made a toy!
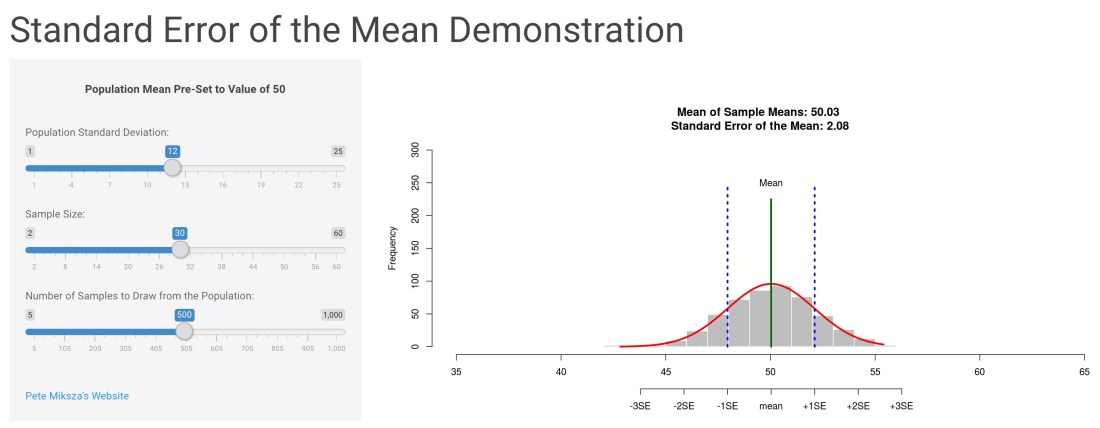
I made a fun little web app for visualizing some interesting things about sampling distributions and the standard error of a mean (pictured below). The app allows you to change parameters with the sliders on the left to see how sample size and standard deviation affect the standard error of a mean — and how sampling distributions of the mean approach normality as the number of samples drawn from a population increases.
You can play with it at this link (or click the picture):
http://js-170-95.jetstream-cloud.org:3838/standard_error/
I built this app in R
I’ve recently been enjoying learning about the possibilities that the free, open-source statistical computing and graphics language “R” offers. It’s an amazingly flexible platform for organizing, visualizing, and analyzing data. Working in R requires acquiring some fluency with basic programming language. However, there is an astounding amount of free learning resources available on the web in the form of websites, books, blogs, tutorials, etc. There are also great web-based courses (https://www.datacamp.com/) that often have free trials.
The program can be downloaded here:
Many recommend also using R Studio, a platform to help organize workflow when using R. The free version of R-Studio is what I use, and I’m fairly sure it has all that most of the folks in music education would likely every need.
More to the point… …R Studio has an integrated web app builder called “shiny“. Shiny makes building data visualization tools and web-based dashboards for exploring data fairly straight-forward. The apps that are produced with shiny are built in roughly the same type of code that is used to run analyses and make plots in R in general.
https://www.rstudio.com/products/shiny/
Why R?
Music ed research folks may wonder why use R instead of say, SPSS, or another commercial statistical package? Well, that could probably be a rather lengthy discussion of pros and cons. However, here’s a short list of some simple things that R is nice for:
- It’s free and open-source with an immense community of users and developers which keeps it well-documented and up-to-date, as well as relevant to the needs of contemporary analysts.
- The R community is very helpful. You could google almost any kind of problem you may be having and would be likely to find a few forums where people offer solutions.
- It’s modular such that there is a package or more than a few packages to do any kind of data wrangling or analyses or plotting you’d ever want to do. For example, there was a point when I would toggle back and forth between SPSS, Stata, and Lisrel depending on what sorts of analyses I was doing. Now I can do it all in R.
- The graphing capabilities are very impressive. It’s fairly easy to get nice-looking, presentation and/or publication ready figures and you can customize any aspect of a graph.
- Organizing the coding for analyses with code in scripts allows you to create a very clear reproducible record of all of the work you do to arrive at your results in any given project. This saves lots of time in the long run and is good scientific practice in general.
